Four numbers I actually watch to read Theta's trajectory
- Analysis
- Theta
- Methodology
- Notes
There is no shortage of ways to measure Theta. The official site has its dashboards. Third-party trackers have theirs. Twitter is full of people pointing at one number and calling it a trend. "Daily transactions are up." "Node count hit a new high." "Staking ratio is strong."
Most of those numbers tell you something. But they don't tell you the same thing, and not all of them tell you what you might think.
After a while of watching the data, I landed on four metrics I actually pay attention to. This post is about how I got there — what I excluded, what I kept, and why I think the way these numbers are compared matters as much as the numbers themselves.
What I left out
Some categories I deliberately don't track when I'm trying to answer "is Theta moving in the right direction?"
Price. TFUEL or THETA price tells me about the market, not the network. Macro conditions, sector rotations, sentiment, news cycles — they all affect price more than actual usage does. A token can trend up while the network underneath it stagnates, and vice versa.
Trading volume. Same problem. Volume measures speculation, not utility. High volume on a quiet day usually means traders, not users.
Total supply, market cap, circulating supply. Token mechanics, not adoption.
Node count, staking ratio, validator count. These are supply-side metrics. They go up because TFUEL rewards make running a node profitable. That's a good thing for network security, but it doesn't tell me whether anyone is using the network. A surge in nodes during a price rally is a market signal, not a usage signal.
Twitter followers, Discord members, AMA attendance. Engagement isn't utility. A project can have ten thousand engaged community members and twenty paying customers. Both numbers matter, but they measure different things.
Subchain count. More chains aren't automatically better. A chain with no traffic is a configuration, not a network.
Number of partnerships announced. Announcements are not deployments. Until I can see traffic from a partner show up in the data, the announcement is a press release.
None of these are bad metrics. They're just answering different questions. If I'm trying to figure out whether Theta is being used more this month than last month, most of them are noise.
What I kept
Four metrics. Each measures a different dimension of demand-side activity.
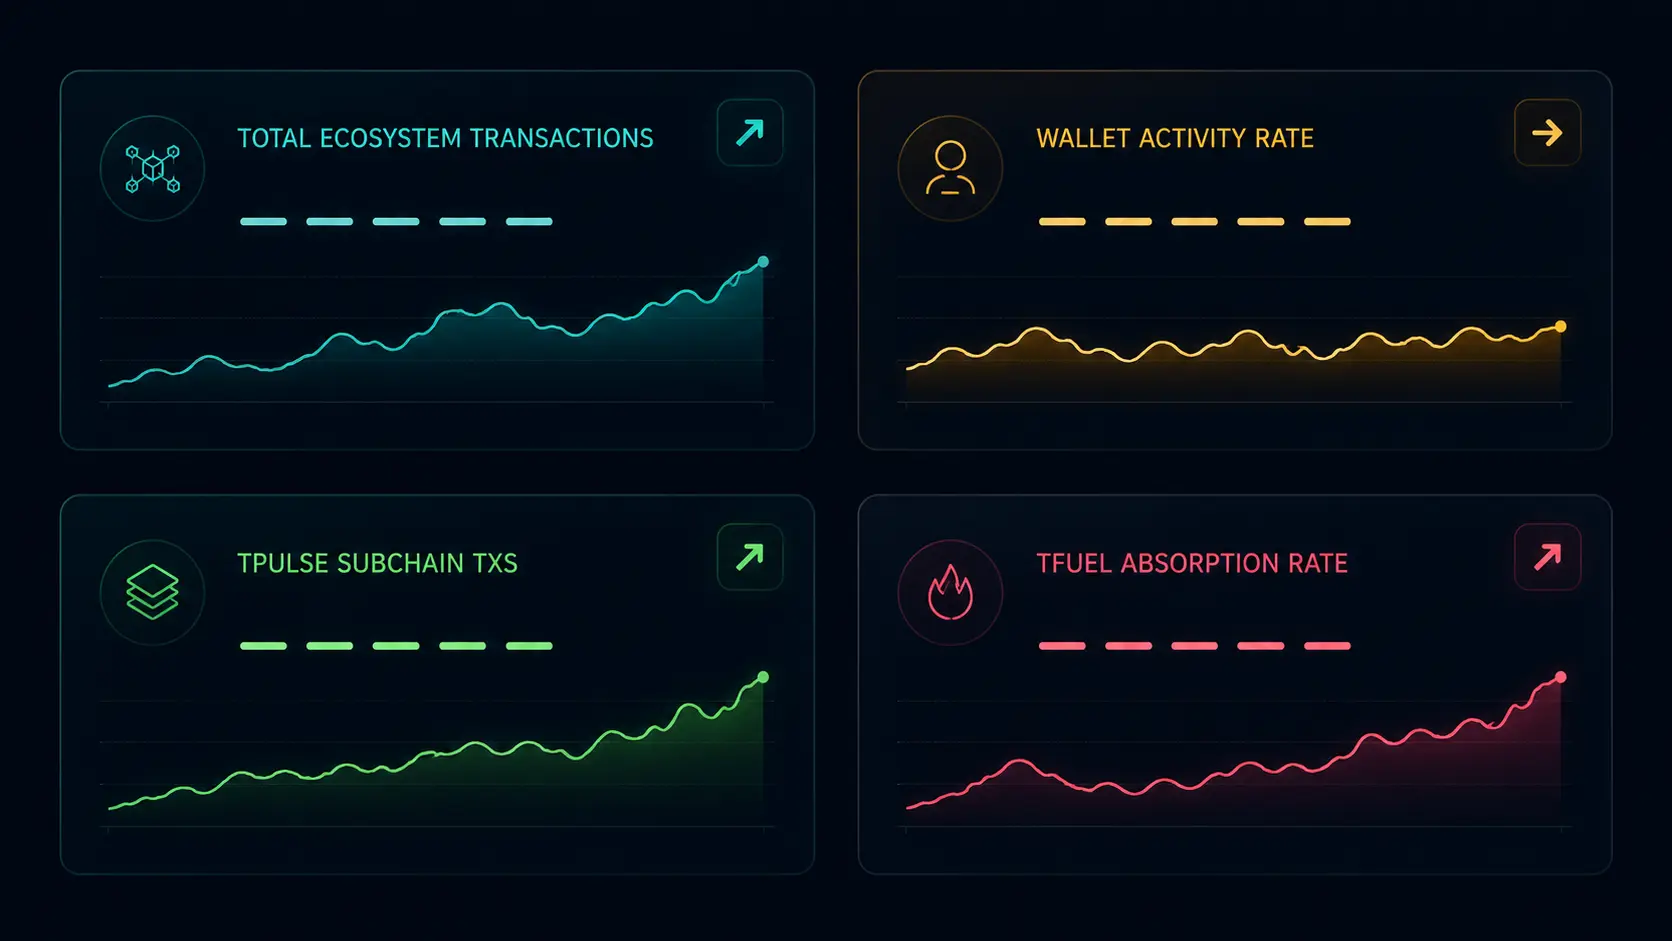
1. Total ecosystem transactions
This is the broadest signal: every transaction on the main chain plus every active subchain, summed.
It catches everything that costs gas — wallet transfers, smart contract calls, subchain settlement, bridging, staking actions, EdgeCloud job logs. It doesn't distinguish quality from quantity, and that's part of why it works as a top-level number. Hard to fake, hard to pump artificially, easy to watch trend over time.
What it doesn't say: it doesn't tell me where the activity is concentrated, or whether it's the "interesting" kind of activity. For that I need the other three.
2. TPulse subchain transactions
TPulse is the subchain that logs EdgeCloud activity — AI inference, GPU jobs, model calls. If Theta's whole strategic narrative is "decentralized AI compute is the future," this is the subchain where that story either becomes real or stays a slide deck.
I track this one separately because it's the most direct signal that something Theta-specific is being used. When Qwen3 launched on EdgeCloud, this is where I'd see the impact. When Alibaba came on board as an enterprise validator, the downstream effect would show up here too — eventually.
The other subchains (gaming, collectibles, health AI) tell me other things, but TPulse is the one most tied to Theta's own bet.
3. Wallet activity rate
This one is more subtle. It's the percentage of blocks that contain real user-initiated transactions, not just system bookkeeping.
A blockchain produces blocks continuously whether anyone is using it or not. Many of those blocks are mostly empty or contain only protocol-level activity. Wallet activity rate filters that out and asks: how many of these blocks have humans (or their bots) actually doing something on the chain?
It's harder to game than transaction count. You can't pad it with system spam. It moves when adoption moves, and not much otherwise.
4. TFUEL absorption rate
This measures how much of the daily TFUEL issuance gets consumed by burns and fees, versus how much just gets generated and sits there.
If TFUEL is supposed to be fuel — the thing the word literally says — then absorption rate is the cleanest test of whether anyone is actually burning fuel. Issuance happens automatically. Absorption only happens when people use the network for something that costs TFUEL.
A rising absorption rate means more of what's being created is actually being used. A falling one means TFUEL is accumulating faster than it's being consumed. Both are information.
Trajectory, not snapshot
The single biggest mistake I think people make with metrics like these is treating them as snapshots.
A daily number on its own doesn't say much. Anyone can pick a high day and announce "Theta is growing." Anyone can pick a low day and announce "Theta is dying." Both are wrong because both are missing the dimension that actually matters: are these numbers moving over time?
So I don't look at a single day. I compare three layers:
- The day's value
- The 7-day rolling average
- The 30-day rolling average
A metric "trends up" when the 7-day average sits meaningfully above the 30-day average — meaning recent activity is consistently higher than the longer-term baseline. A metric "trends down" when it's the other way around.
This setup does two things at once.
First, it filters out one-day spikes. A bot attack or an artificial pump doesn't change the 7-day average enough to register. You need sustained, real movement to shift the trajectory.
Second, it makes direction visible. The question isn't "is this number big?" — it's "is this number moving the right way?" Those are very different questions, and only the second one matters for trajectory.
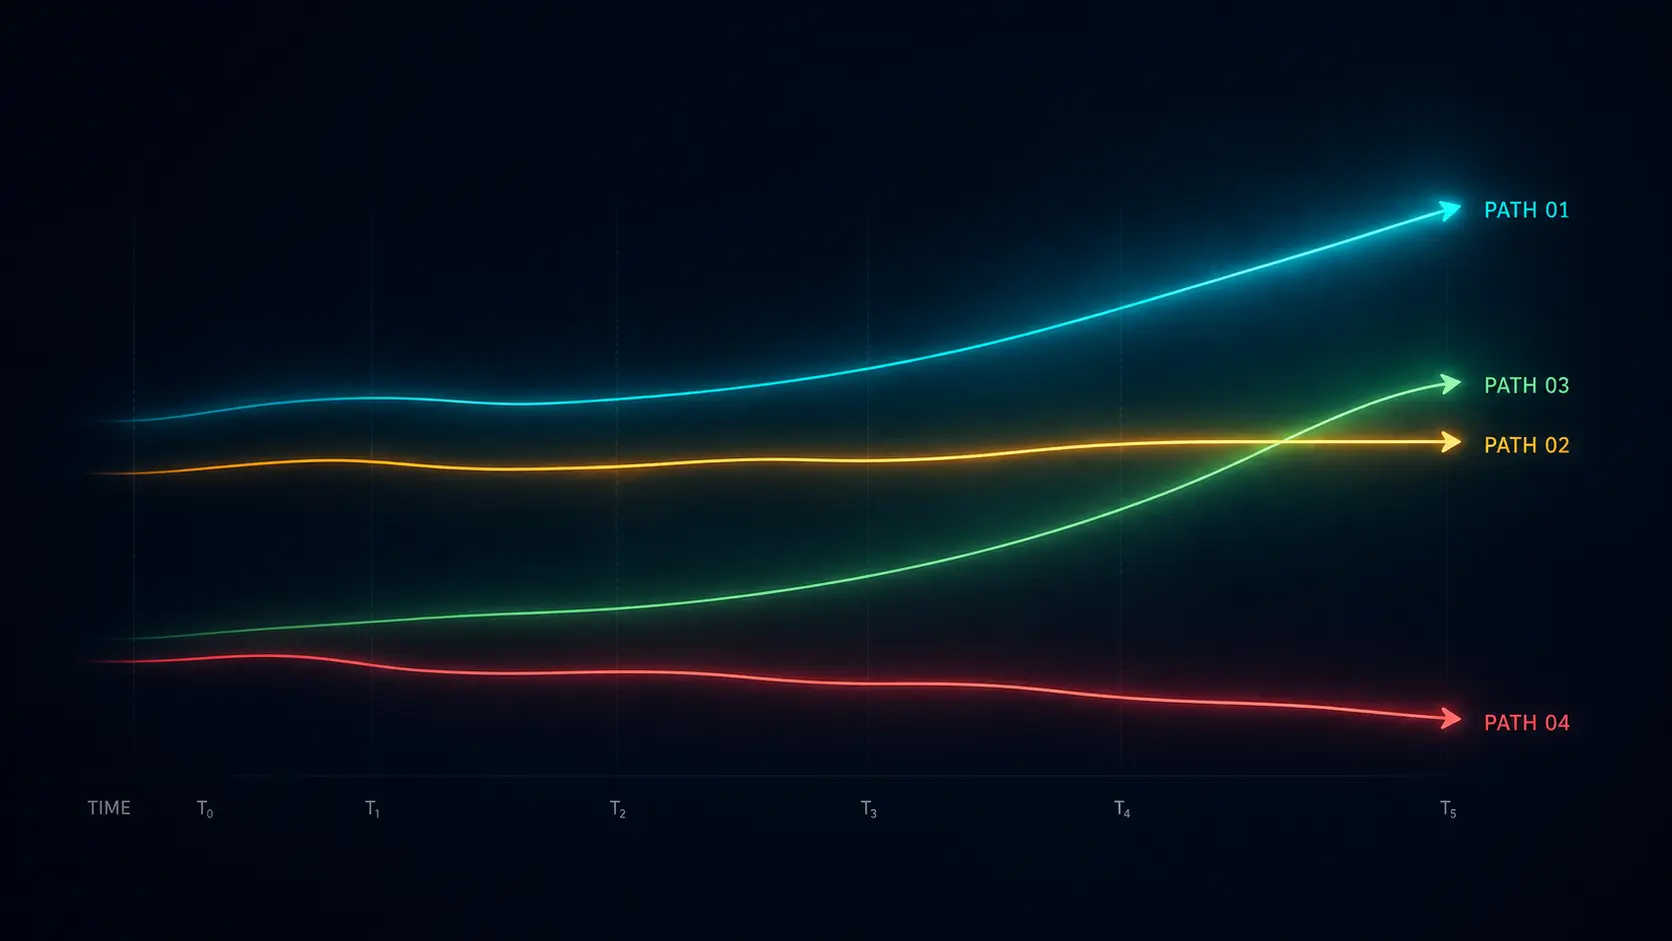
What the four say together
Four metrics, four dimensions. Total ecosystem activity for breadth. TPulse for AI-specific use. Wallet activity rate for real human (or bot) engagement with the chain. Absorption rate for whether TFUEL is actually being burned as fuel.
If all four trend up, the trajectory is clear and positive. If all four trend down, the trajectory is clear and negative. If they point in different directions — which is often the case — that's information too. It means the picture is mixed, and any single-number narrative someone offers you is probably oversimplified.
Right now, as I write this, the four are mixed. I'm not going to put specific numbers in this post — that's not what this post is about — but the situation is not uniform.
That's actually the point. A measurement framework that always agrees with itself isn't measuring much. A framework that occasionally disagrees with itself, and forces you to think about why, is doing real work.
What this isn't
I want to be clear about what this framework is and isn't.
It isn't the only valid way to look at Theta. If you trade based on price action, your relevant metrics are different. If you operate a node, you care about reward economics. If you build on Theta, you care about API uptime and latency. Different observers, different questions, different metrics. None of them are wrong — they're just answering different things.
It also isn't a prediction system. These four numbers describe what's happening, not what will happen. Trajectory can change. New use cases can emerge. Existing ones can fade. The framework is a way to see clearly, not a way to see ahead.
And it's a hypothesis, not a conclusion. After more time and more data I might decide one of these four is less useful than I currently think, or that there's a fifth I'm missing. That's fine. The point isn't to lock in the right answer — it's to have a defensible process for asking the question.
— Jacob